It’s week three of the month, and the finance manager at a specialist subcontractor is staring at three concurrent projects – all profitable on paper, all draining cash simultaneously. Retention is held on all three, two clients are paying late, and next week’s subcontractor payments total more than the bank balance. A profitable business, technically insolvent.
That scenario – profitable but cash-negative – is uniquely common in construction. This guide covers how to forecast cash flow at project level, including payment timing under the Construction Act, retention mechanics, the S-curve model, timing mismatches between income and expenditure, common mistakes, and how to aggregate project-level forecasts into a company view.
For cost and profitability forecasting (a related but different discipline), see What Is Construction Forecasting.
Why cash flow forecasting is different in construction
Construction has characteristics that make cash flow uniquely difficult to manage:
- Long project timelines. Months or years between start and final payment. Cash is tied up the entire time.
- Payment in arrears. You do the work, apply, wait for certification, then wait again for payment. The Construction Act 1996 (as amended 2011) sets minimum payment terms – but “minimum” still means 30-60 days from application.
- Retention. Typically 5% withheld from each valuation, reducing to 2.5% at practical completion, with final release after defects (often 12+ months later). That’s income you’ve earned but can’t touch.
- Front-loaded costs. Mobilisation, plant, materials procurement – significant expenditure before your first valuation income arrives.
- Subcontractor payment cycles. Your subs apply on their own schedule. You pay them on your terms. Your client pays you on theirs. These cycles rarely align perfectly.
The result: a project showing healthy profit on the CVR can simultaneously be draining cash from the business. Profit tells you the project is worthwhile. Cash flow tells you whether you’ll survive long enough to collect it.
"With Planyard, I have great visibility of who I'm going to pay coming up, so I can plan our cash flow. Cash flow is the most important thing in the construction industry – if it runs out, you're in deep trouble. Having that visibility makes a real difference."
Read more
Cash flow is not profitability
This distinction is critical and frequently misunderstood:
| Question | Answered by |
|---|---|
| Will this project make money? | Cost/profitability forecast |
| Will we have money in the bank this month? | Cash flow forecast |
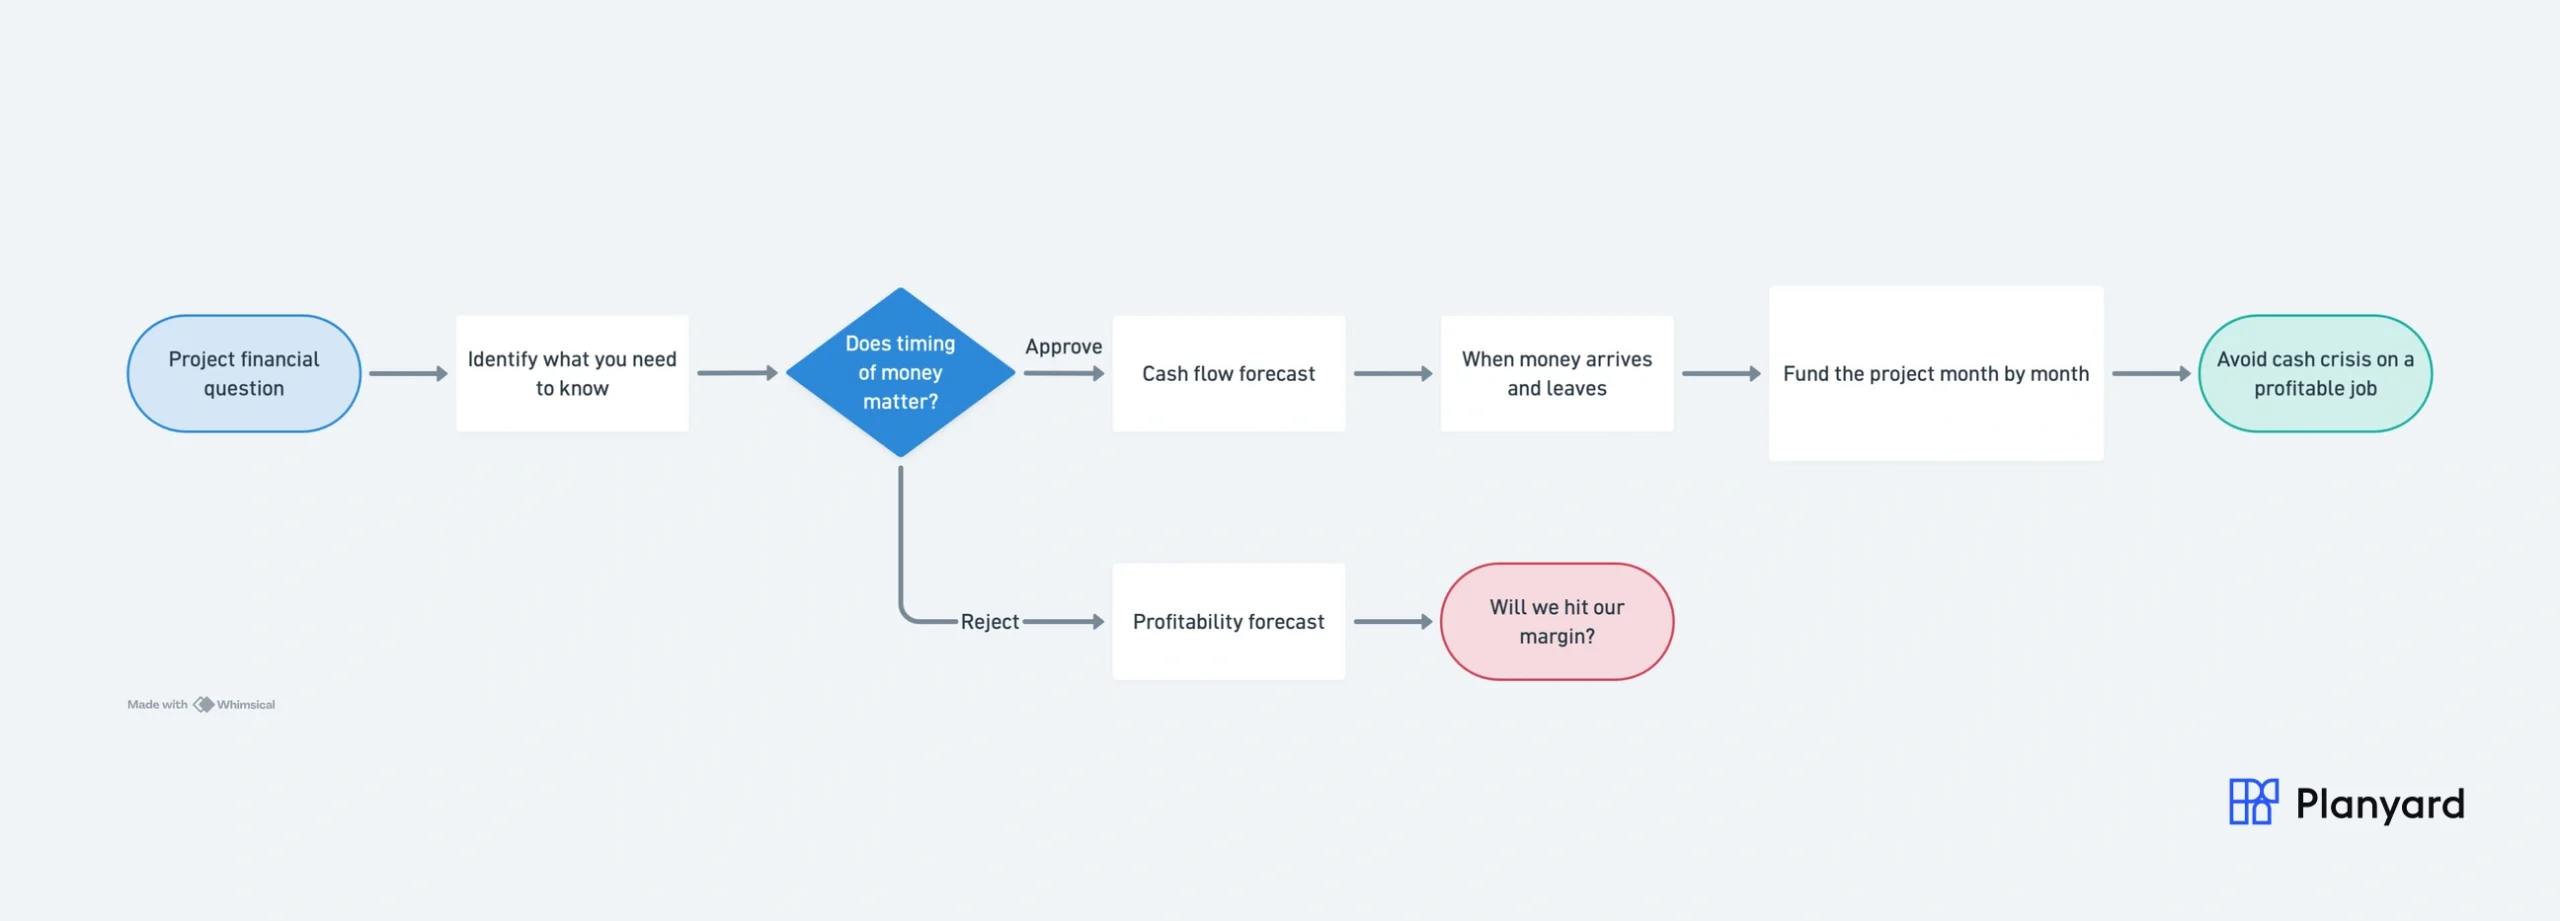
A project can be profitable but cash-negative for months – you’re spending faster than you’re getting paid. Conversely, a project can look cash-positive while actually losing money – front-loaded applications create the illusion of surplus while costs accumulate underneath.
You need both forecasts. The profitability forecast tells you whether the project is commercially viable. The cash flow forecast tells you whether you’ll have the working capital to execute it.
Building a project cash flow forecast
Income (cash in)
Forecast when you’ll actually receive money – not when you earn it:
| Income item | Timing | Watch out for |
|---|---|---|
| Applications | Monthly, per programme | Actual progress vs planned – shortfalls delay income |
| Payment terms | 14 days due + 14-28 days final | Construction Act minimums – check your contract |
| Certification | With payment cycle | Clients rarely certify 100% – budget for 90% typical |
| Retention | 5% withheld per application | Half at PC, remainder after defects (12+ months) |
| Variation income | Months after cost incurred | Work happens now; payment arrives after formal agreement |
| Pay-less notices | Before final date for payment | Budget for some client reduction on each application |
Expenditure (cash out)
| Expenditure item | Typical timing | Notes |
|---|---|---|
| Subcontractor payments | Monthly applications, 30-day terms | Their application cycle rarely aligns with yours |
| Materials | Varies – deposit, on delivery, or 30 days | PO terms vary widely by supplier |
| Labour | Weekly or monthly payroll | Most predictable outgoing |
| Plant and equipment | Weekly/monthly hire or staged purchase | Hire costs continue through delays |
| Preliminaries | Monthly ongoing | Site management, cabins, welfare, security |
| Professional fees, bonds | Upfront or quarterly | Often front-loaded before first income |
The S-curve
Construction expenditure typically follows an S-curve pattern:
- Slow start: mobilisation, setting up site, early procurement
- Rapid acceleration: main works in full swing, multiple trades on site
- Peak: maximum concurrent activity
- Tail off: finishing trades, commissioning, defects
Income follows the same S-curve shape – but lagged by the payment period (typically 4-8 weeks). The gap between the expenditure curve and the income curve is your cash funding requirement. It’s widest during the ramp-up phase when you’re spending fast but income hasn’t caught up yet.
"The system allows you to effectively maintain cash flow and draw from your contract with the client exactly as you need it, ensuring that your finances stay at the right level throughout the project."
Read more
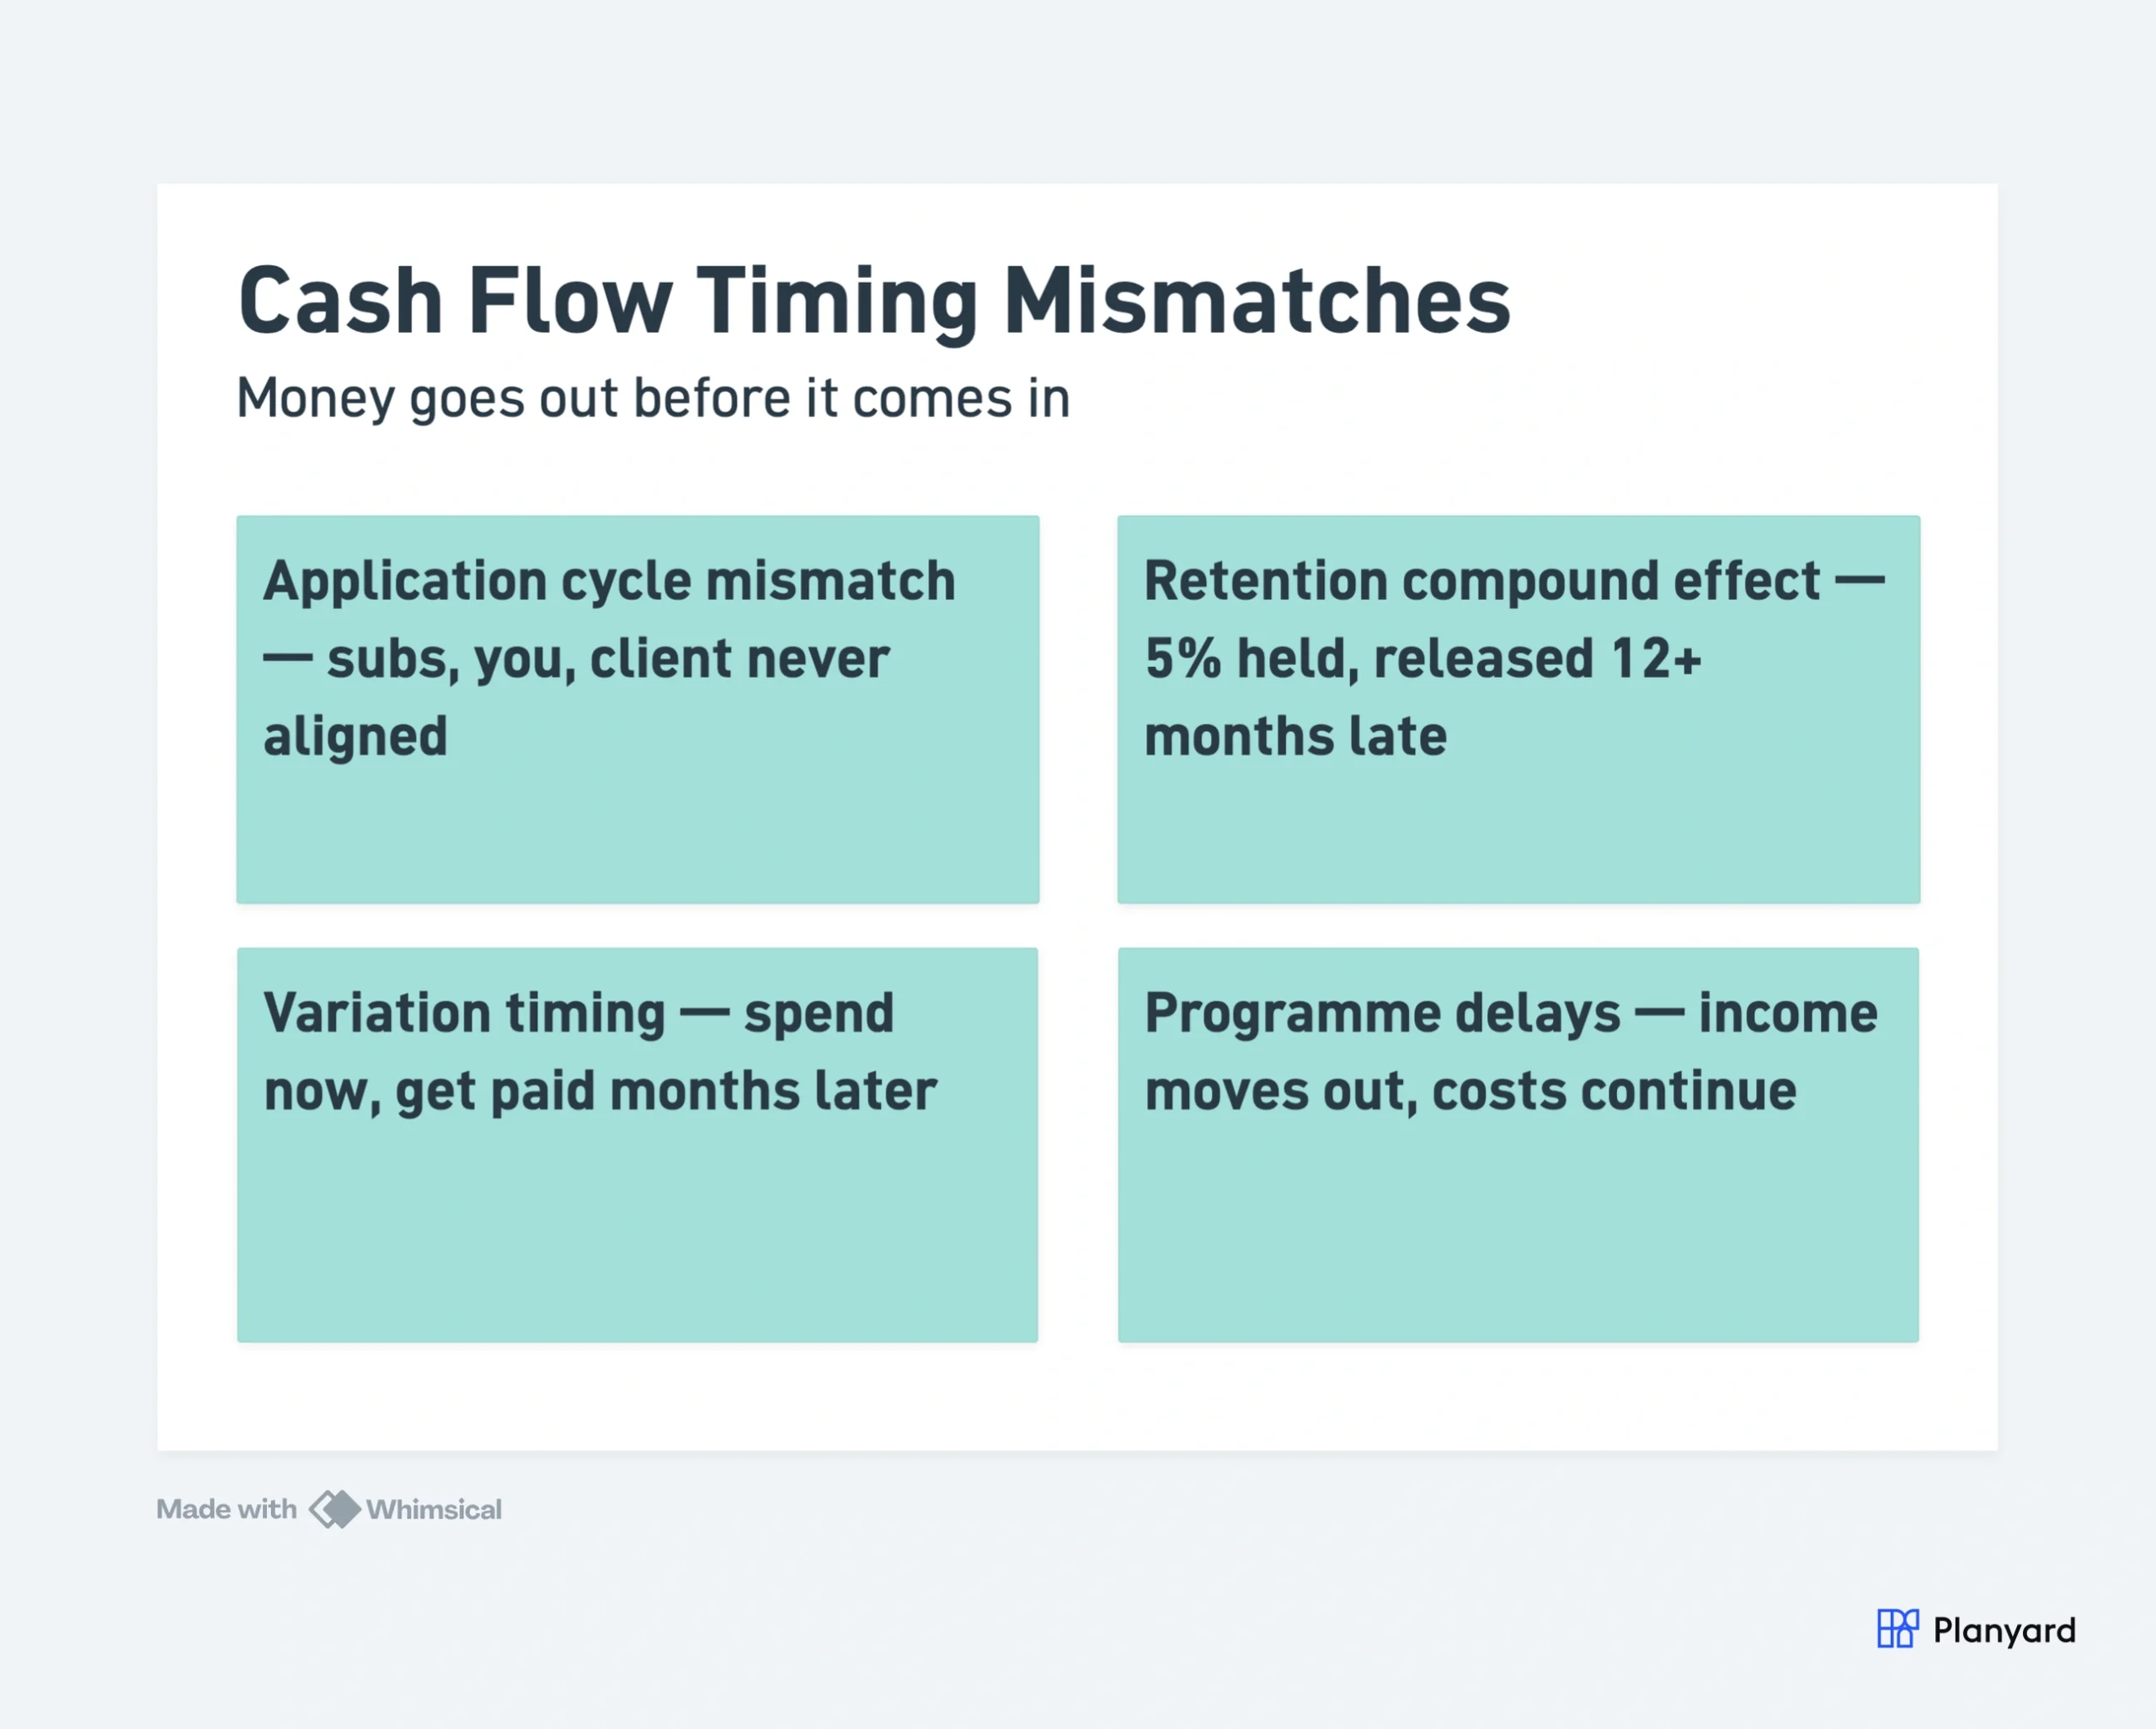
Timing mismatches: the construction cash flow challenge
The core cash flow challenge in construction is timing. Money goes out before it comes in – always. The question is how wide the gap is and whether you can fund it.
Key timing mismatches:
- Application cycle mismatch: your subcontractors apply to you on the 25th. You apply to the client on the 1st. Your client pays you on the 28th. You pay your subs on the 25th of the next month. The timing never aligns perfectly.
- Retention compound effect: 5% of income withheld each month, but you may not withhold retention from subcontractors (or hold less). Net retention = permanent cash drain until release.
- Variation timing: you spend the money now (paying subcontractors for varied work). The client doesn’t pay for the variation until it’s formally agreed – which can take months.
- Programme delays: if the programme slips, your income moves out (fewer applications) but your costs continue (prelims, plant on hire, labour standing). Cash position deteriorates without any change in final profitability.
Understanding these mismatches is why tracking commitments matters for cash flow – commitments represent your future cash outflows. Knowing the quantum lets you forecast the timing.
Monthly cash flow forecasting process
- Forecast this month’s application value. Based on programme progress and valuation methodology. What work will be complete by the application date?
- Apply payment terms. When will that income arrive? Due date + final date for payment = actual receipt date.
- Deduct retention. 5% of application value won’t arrive until later. Adjust.
- Forecast subcontractor applications. What will your subs apply for this month? Based on their progress and your assessment.
- Apply your payment terms. When will you pay them? Your contract terms determine this.
- Add other outgoings. Labour payroll, material deliveries this month, plant hire, prelim costs.
- Calculate net position. Opening balance + income received – expenditure paid = closing balance.
Roll this forward month by month for the remaining project duration. The result is your project cash flow forecast – showing when you’ll be cash-positive and when you’ll need funding.
Forecast cash flow from committed cost data
See future cash outflows from your committed subcontracts and POs. 14-day free trial.
Common cash flow forecast mistakes
| Mistake | Why it hurts |
|---|---|
| Assuming the client pays on time | They often don’t. If they typically pay 7 days late, forecast accordingly |
| Forgetting retention drag | 5% of every application held back. On a £2M project, that’s £100K locked for 12-18 months |
| Not forecasting variation income separately | Variation income is always delayed relative to cost. Forecast it with realistic timing |
| Ignoring subcontractor payment timing | If 60% of subs apply in the same week, you have a large concentrated outgoing |
| Not updating when programme slips | Delays move income out but costs continue. A two-month slip can create a £200K shortfall |
Many of these mirror the reasons construction forecasts go wrong – the same structural issues affect both cost and cash flow predictions.
"With Planyard, the financial data is live, meaning you have a real-time view of where the project stands at any moment. When I was relying on Excel, I could only manage that kind of insight once a month. The transition from monthly snapshots to a live dashboard has completely changed how we monitor our project health."
Read more
Company-level vs project-level cash flow
Each project has its own cash flow profile – its own S-curve, its own timing, its own funding requirement. But the company’s cash position is the sum of all project cash flows plus overhead costs.
This creates both risk and opportunity:
- Cross-funding: one project’s cash surplus can fund another’s cash deficit. This is normal and healthy – as long as it’s visible and managed.
- Concentration risk: if multiple projects hit their cash troughs simultaneously (common when projects start in the same quarter), the combined funding requirement can exceed your facility. This is how otherwise-healthy businesses hit cash crises.
- Aggregation: the company-level cash flow forecast aggregates all project forecasts plus overhead run-rate. It shows whether you can fund your current workload – and whether you can afford to win the next tender.
Company-level visibility requires project-level accuracy first. If your individual project forecasts are wrong, the aggregate is worse – errors don’t cancel out, they compound.
Tools for cash flow forecasting
Cash flow forecasting in construction has traditionally been a spreadsheet exercise – often a separate model from the cost forecast, maintained by a different person, updated at different intervals. This disconnect is itself a source of error.
Spreadsheet S-curve models: common in QS practice. Build an expenditure curve from programme, apply payment terms. Works for single projects. Breaks down across a portfolio (too many spreadsheets, no aggregation).
Integrated platforms: connect the cost forecast (what you’ll spend) to the cash forecast (when you’ll spend it). When committed costs and payment terms are in the same system, cash flow visibility follows naturally.
Construction forecasting software that tracks commitments and payment schedules provides the foundation for cash flow visibility. Teams typically get their first project live in under a day and start seeing future cash outflows from committed orders immediately.
For contractors using Xero, Planyard integrates directly – giving you project-level cash flow data that feeds into your Xero-based company view.
"Planyard gives our MD a chance to make good, informed decisions, whereas before he was worried about making those decisions because he didn't really know where we were. Even when we can see difficult times ahead, at least we can plan for them now."
Read more
Key takeaways
- Cash flow and profitability are different questions requiring different forecasts
- Construction-specific factors (retention, payment terms, front-loading) make cash flow uniquely challenging
- The S-curve gap between expenditure and income defines your funding requirement
- Timing mismatches compound across multiple projects – aggregate visibility is essential
- Commitment data is your best predictor of future cash outflows
- Cash flow is the #1 cause of construction insolvency – forecasting it isn’t optional
Start with your biggest project. Map the payment terms. Identify the timing mismatches. Build the S-curve. Then aggregate across your portfolio. That’s your cash flow forecast – and it might tell you something your profitability numbers don’t.
Cash flow visibility from committed cost data
Know what you owe before invoices arrive. Plan cash across your whole portfolio.